


| Passenger numbers up 7% Spring 2025 on Spring 2024 Posted by grahame at 11:40, 31st October 2025 |     |
https://dataportal.orr.gov.uk/statistics/usage/passenger-rail-usage/
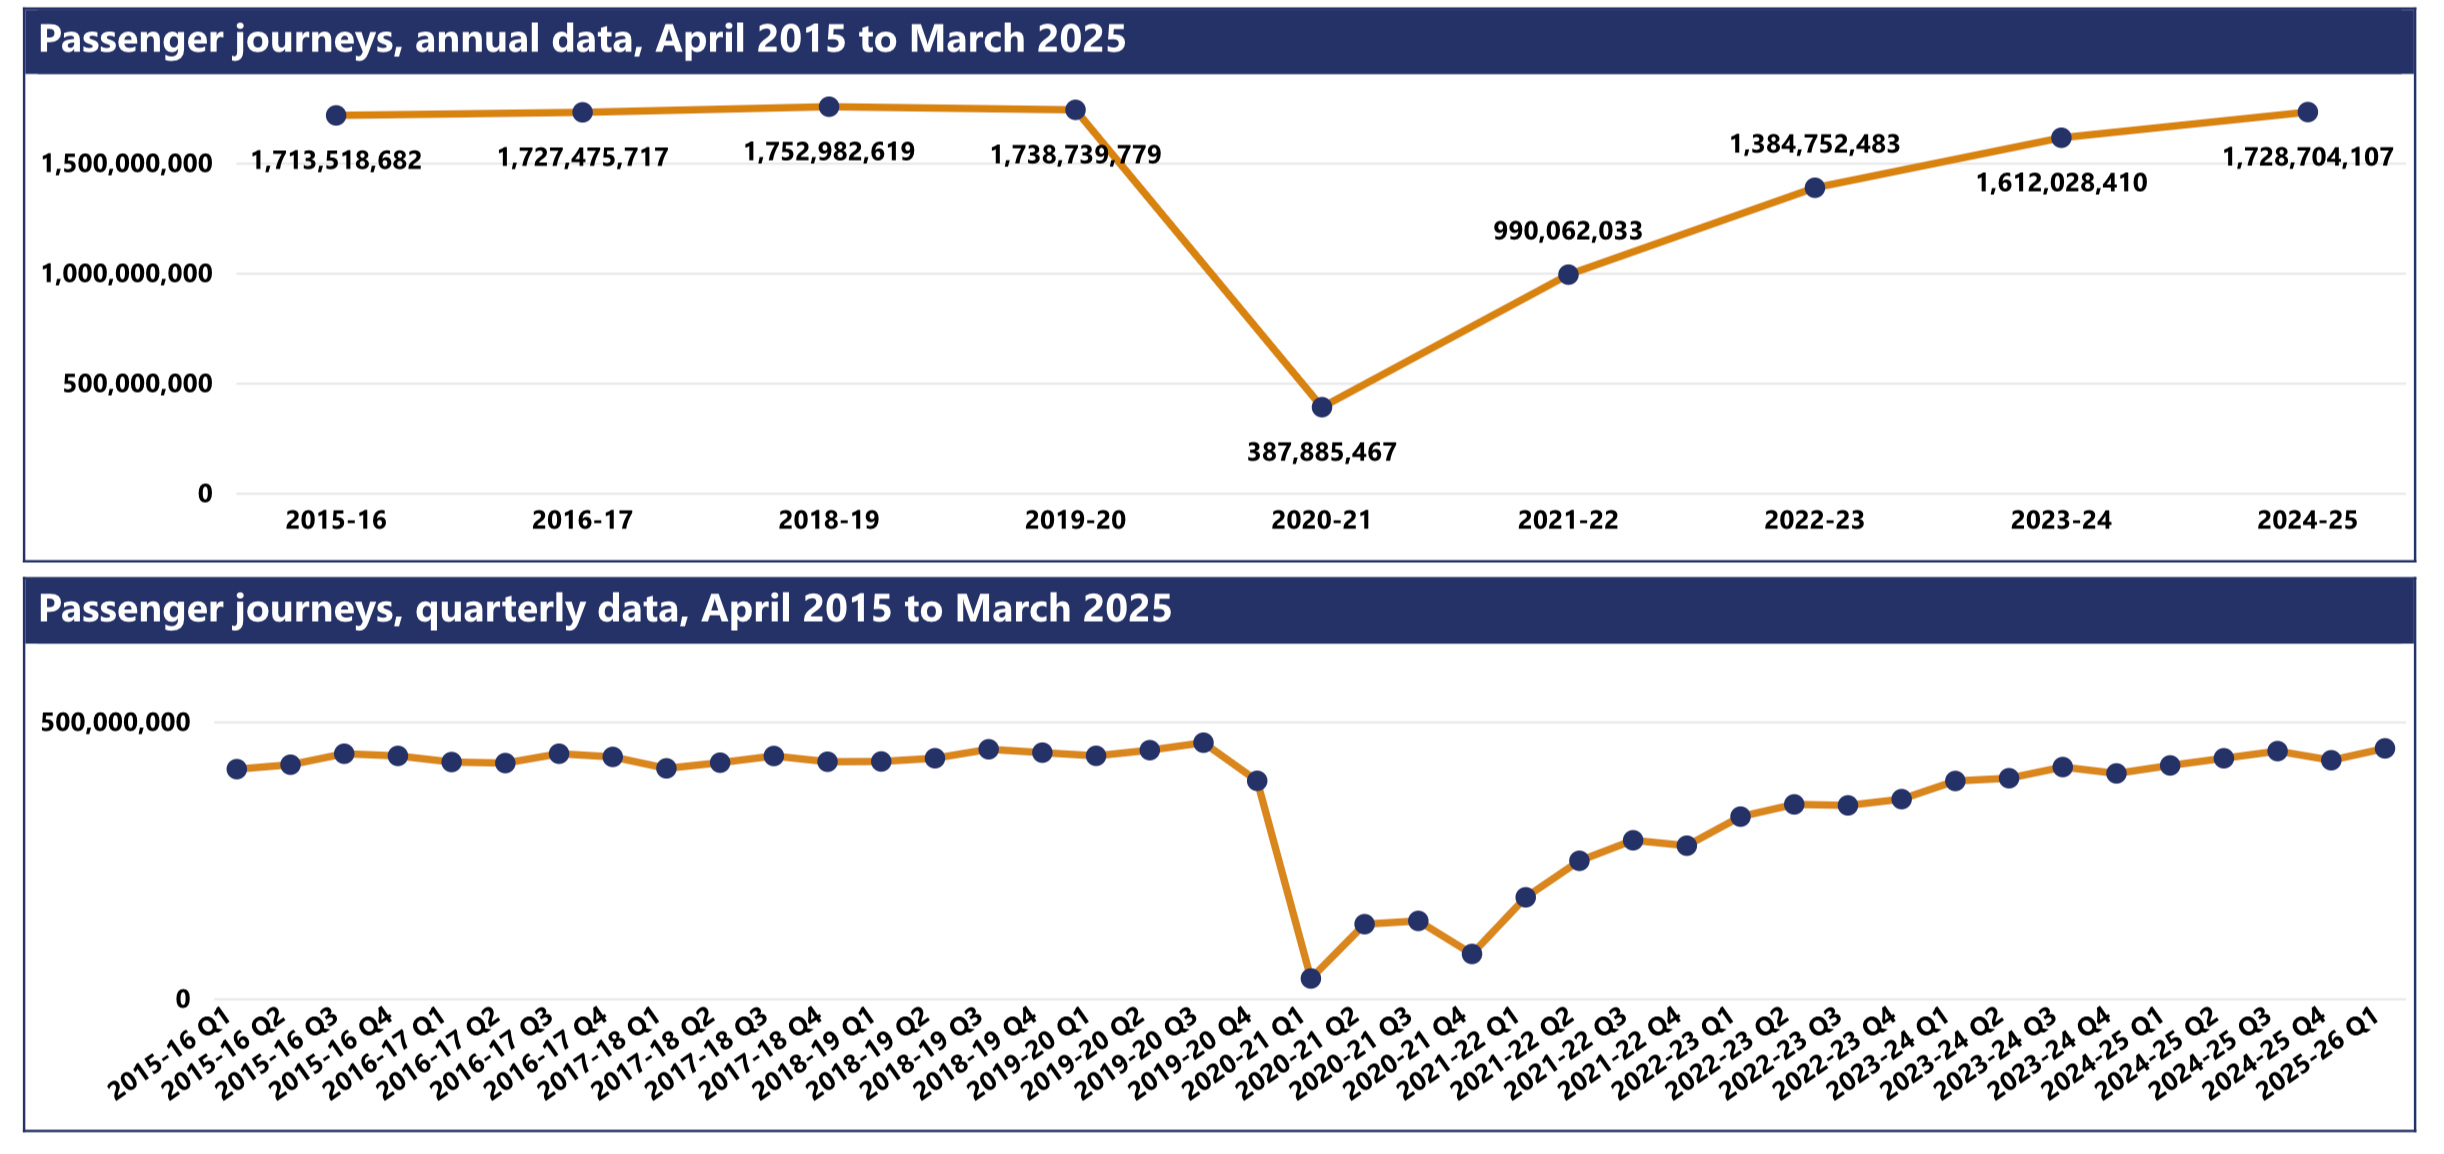
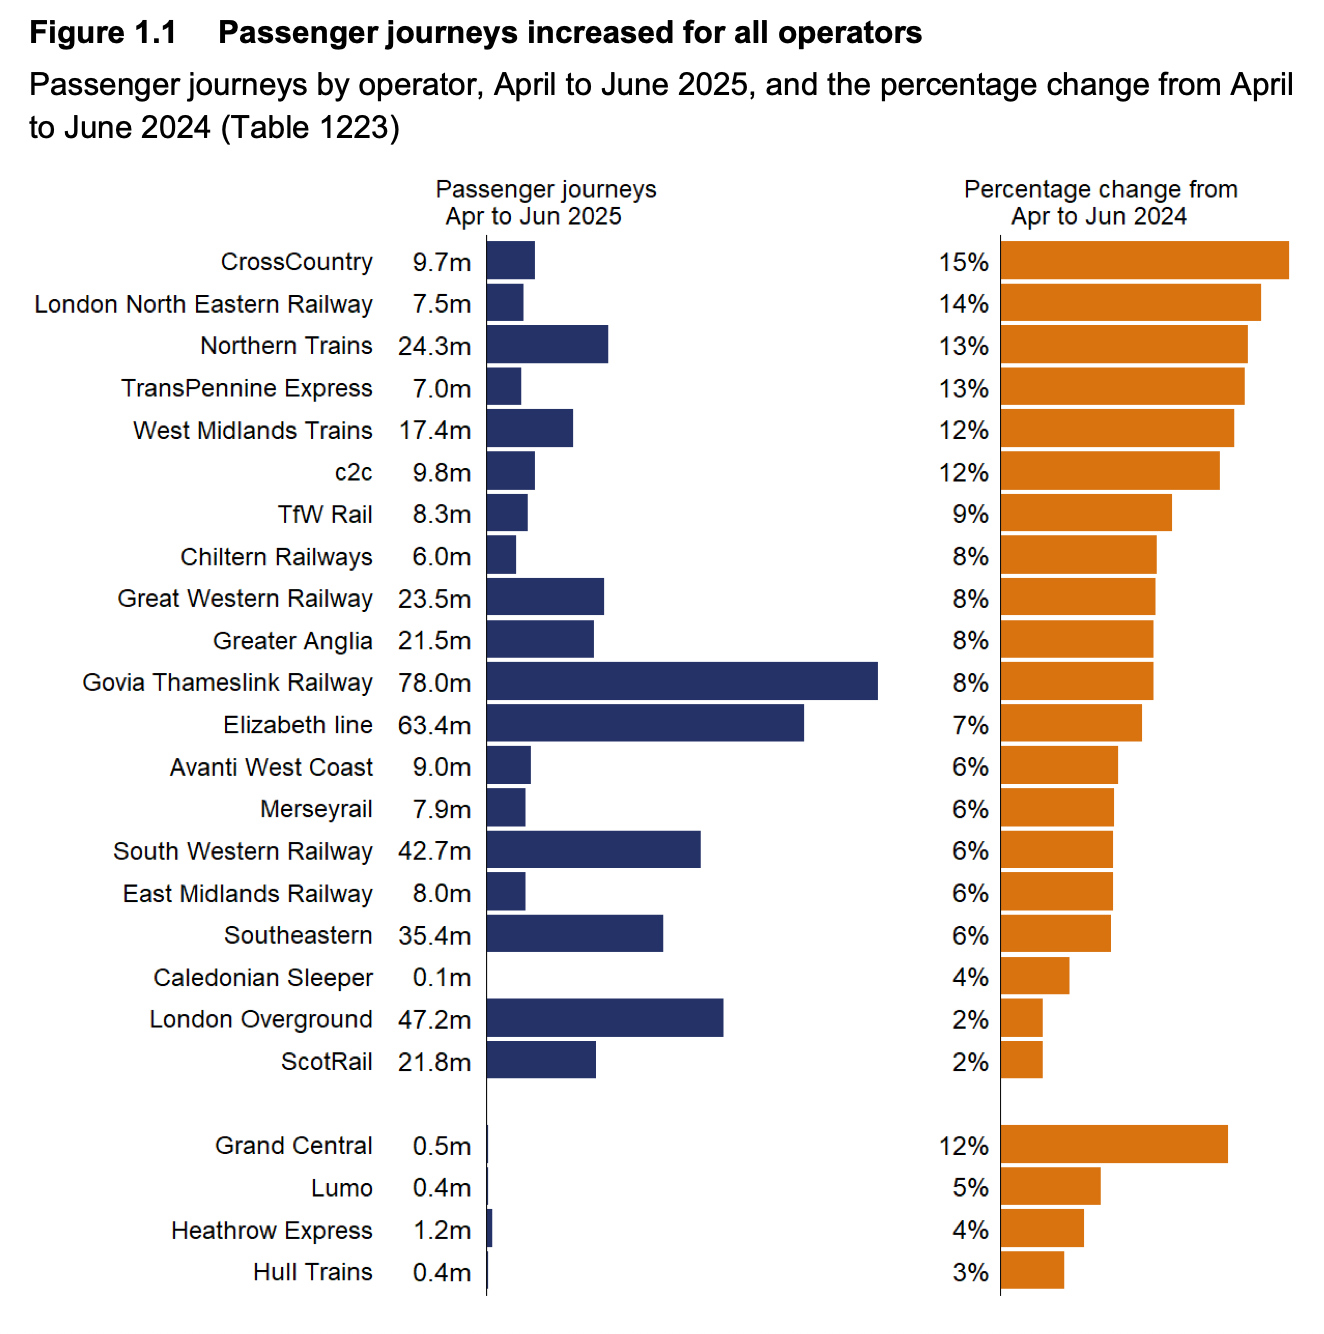
A total of 451 million journeys were made by rail passengers in Great Britain in the latest quarter (April to June 2025). This is a 7% increase on the 420 million journeys in the same quarter in the previous year (April to June 2024).
Total passenger revenue was £3.1 billion in the latest quarter. This is 6% more than the £2.9 billion generated in the same quarter in the previous year (when adjusted for inflation).
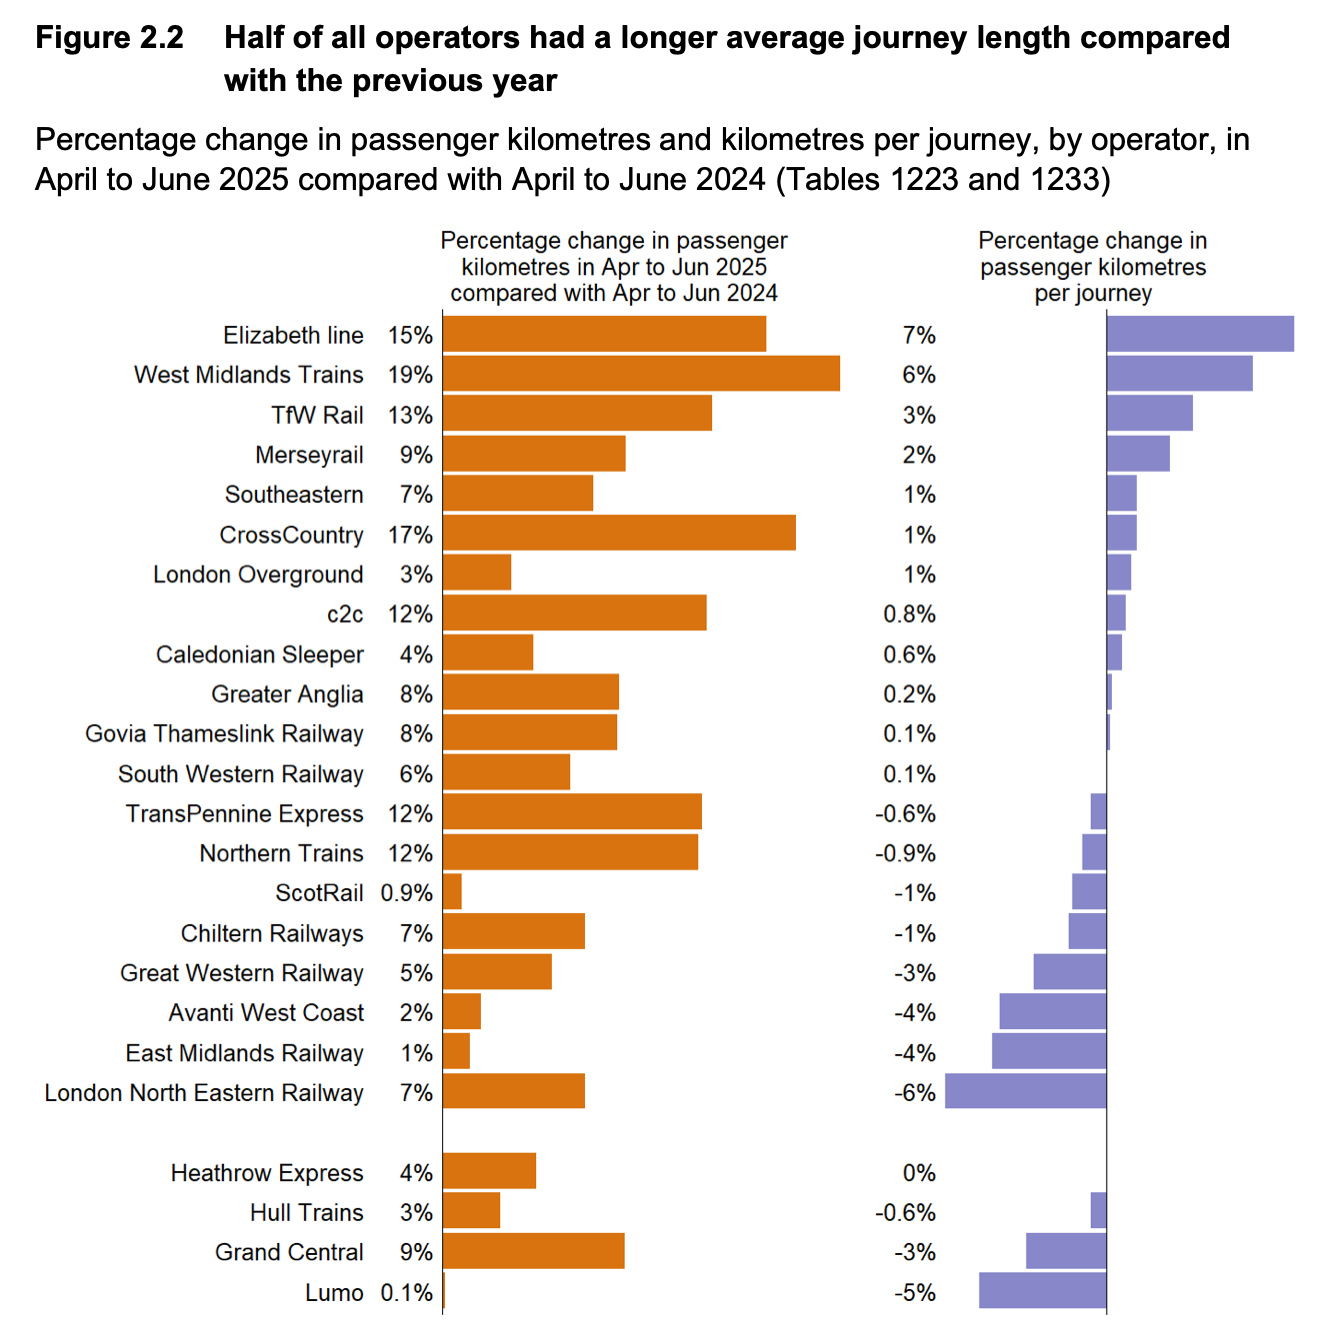
There were 17.1 billion passenger kilometres travelled in total in Great Britain. This is a 7% increase compared with the 15.9 billion travelled in the same quarter in the previous year.
Total passenger revenue was £3.1 billion in the latest quarter. This is 6% more than the £2.9 billion generated in the same quarter in the previous year (when adjusted for inflation).
There were 17.1 billion passenger kilometres travelled in total in Great Britain. This is a 7% increase compared with the 15.9 billion travelled in the same quarter in the previous year.
I have mirrored fuller report (here)
| Re: Passenger numbers up 7% Spring 2025 on Spring 2024 Posted by ChrisB at 11:54, 31st October 2025 | |
No surprise that LNER is worst - what with their fares 'simplification'/rises
| Re: Passenger numbers up 7% Spring 2025 on Spring 2024 Posted by John D at 12:07, 31st October 2025 | |
It is a shame ORR only include an annual change, and not a percent comparison with same quarter in 2019 (last April-June pre covid lockdowns) in their report.
But you can have some fun comparing the figures and changes in tables 1223, 1233, 1243, 1253 etc.
Soon find that GWR (SWR is far worse) that dividing train km by vehicle km shows average number of carriages per train has shrunk. Comparing the passenger figures and km on GWR with vehicle km suggests people are on average travelling further too. This rather suggests that crowding (and overcrowding) must be more common (although I accept IET carriages have more seats than some of the older stock, although IETs were generally in service by spring 2019)
Actually the figures make me wonder if GWR has grown in passengers, but failed to do much about it as it limps on in zombie management contracts mode. Saying haven't done anything is not strictly true, they have secured some 175s (still not in service though), but lost the 769s (never used), and lost some 387s and a 158 without replacement.
| Re: Passenger numbers up 7% Spring 2025 on Spring 2024 Posted by John D at 20:46, 31st October 2025 | |
I did a bit more delving into the ORR figures and have compared the latest quarter (April-June 2025) with the same quarter 6 years ago before lockdown.
For GWR
Passenger journeys 92.64% of 2019
Passenger km is 103.72%
Dividing km by passenger numbers to get average journey length, then calculating change is 111.96%. So average GWR passenger is travelling 12% further than 6 years ago (I guess the loss of some short journeys to Elizabeth line might be a factor here)
Train Km is 106.38% of 2019
Vehicle km is 99.22%
Although the number of train km has gone up, average train length has fallen from 6.387 vehicles in 2019 to just 5.957 vehicles in 2026
Clearly if passenger km has changed 103.72% in 6 years, but vehicle km is only 99.22% then about 4.5% more passengers per vehicle which confirms trains are on average busier.
Looking at it in reverse, GWR needs to operate 4.5% more vehicle km, to reflect the increase in passenger km over 6 years.
| Re: Passenger numbers up 7% Spring 2025 on Spring 2024 Posted by Hafren at 20:54, 31st October 2025 | |
Re the potentially more crowded trains, I wonder how the distribution of passengers across the day comes into this.
Less busy peaks, but busier off-peak trains? More spread of those extra passengers during the off-peak, or all crowding onto the same number of peak-shoulder trains, I wonder?
There have been a few times in the last couple of years when I've paid extra to travel out of PAD during the peak, taking advantage of a Didcot split (NSE card fare east thereof, and unrestricted evening peak on the off-peak fare west thereof), and have been happy to find myself of comfortably empty trains, compared to rather busy peak-shoulder trains.
IETs being longer than HSTs (unless in the dreaded 5 car formation) and Electrostars being longer than Turbos perhaps means the base formation is longer on certain routes at least. OTOH on a route like the Golden Valley where a 5 car IET is the baseline (on London runs), perhaps the daily average capacity is somewhat reduced!
| Re: Passenger numbers up 7% Spring 2025 on Spring 2024 Posted by grahame at 21:56, 31st October 2025 | |
No surprise that LNER is worst - what with their fares 'simplification'/rises
Passenger journey numbers up, passenger mileage down. Perhaps because open access operators are cherry picking (abstracting) some very long distance biggest hub flows? LNER cash balances maintained by the simplification that eliminates many of the better bargains and so puts prices up without being a headline rise. Just a theory.
| Re: Passenger numbers up 7% Spring 2025 on Spring 2024 Posted by John D at 14:32, 19th March 2026 | |
Latest ORR quarterly data is now published
https://dataportal.orr.gov.uk/media/2hto1os3/passenger-rail-usage-oct-dec-2025.pdf
For GWR
Passenger numbers up 6% on 2024 to 23.8m
Passenger km up 5% on 2024
so on average journeys are 0.5% shorter
Train km up 3% to 11.6m km
Vehicle km up 2% to 68.2m km
so trains have on average got bit shorter
Clearly if passenger km increase is 3% more than train carriage km increase, then on average every journey is now 3% busier (so crowding is more likely).
Anyone care to explain logic of why if passengers are growing, GWR shorten the average number of carriages per train please
| Re: Passenger numbers up 7% Spring 2025 on Spring 2024 Posted by a-driver at 15:04, 19th March 2026 | |
Anyone care to explain logic of why if passengers are growing, GWR shorten the average number of carriages per train please
DfT cost saving.
| Re: Passenger numbers up 7% Spring 2025 on Spring 2024 Posted by eightonedee at 17:16, 19th March 2026 | |
Anyone care to explain logic of why if passengers are growing, GWR shorten the average number of carriages per train please
DfT» cost saving
Possibly also because (as I understand it) we've lost some of the Electrostar fleet to other routes. To be fair (but see concluding comment below) a lot of this was because there were a lot of 8-car Electrostar trains running very lightly loaded off-peak between Paddington and Didcot.
BUT... had we got the electrification all the way to Oxford and on the Thames Valley branches as I believe was anticipated when they were ordered, those trains (and the ones refitted for Heathrow Express use) might have been more fully used.
| Re: Passenger numbers up 7% Spring 2025 on Spring 2024 Posted by ChrisB at 17:52, 19th March 2026 | |
DfT» cost saving
Possibly also because (as I understand it) we've lost some of the Electrostar fleet to other routes.
One & the same.....
